Leading Climate and Environmental Stewardship

ATGL has embedded environmental stewardship into the core of its growth strategy, in line with India’s transition to a low-carbon economy. Through investments in decarbonisation, circular economy practices, ecosystem conservation and strong governance mechanisms, we strengthen operational sustainability while supporting India’s energy transition and environmental security.


We emphasise resource efficiency and are taking significant measures to progress toward a net zero future.Key Highlights, FY 2025-26
 We emphasise resource efficiency and are taking significant measures to progress toward a net zero future.
Climate Change and Decarbonisation
Water
Waste
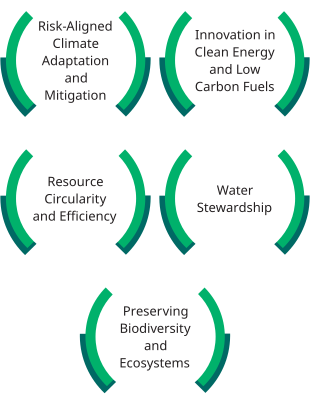
Strategic Focus Areas
ATGL’s Approach to Environment Management
Governance and Oversight
Our environmental agenda is driven from top to bottom ensuring accountability at every level of the organisation.
Policy Guidance
Our actions are formally guided by a strong framework of our Climate Change Policy, ESG Policy and the Quality, Health, Safety & Environment (QHSE) Policy
Board Level Oversight
The Board-led Corporate Responsibility Committee (CRC), comprising 100% Independent Directors oversee climate and ESG strategies and assures the Board on the performance
Management Level Oversight
The CEO and CSO oversee the day-to-day execution of the Board-led ESG agenda across operations and provide quarterly updates to the Board
Integrated Management System (IMS)
In the Oil & Gas Sector, we stand as a pioneer with an Integrated Management System (EMS) that addresses regulatory requirements in a systematic and cost-effective manner. Our EMS framework looks beyond traditional compliance boundaries and tackles non-regulated issues, such as energy conservation, while fostering stronger operational control, robust monitoring mechanisms and enhanced employee participation.
Integration of Controls Across GAs
Compliance is strengthened through IMS-aligned internal audits and independent third-party assurances across all GAs to validate design and effectiveness of operational controls. This is supported by periodic regulatory inspections and continuous monitoring systems.
100%of Geographical Areas (by revenue contribution) are audited under ISO 14001 (EMS), of which 6 are audited by accredited third-party agencies and 28 through certified internal auditors
Capability Building
Structured employee training and awareness workshops on energy efficiency, water conservation, waste management and pollution prevention drives progress towards our climate and environmental goals.
Environmental and Social Impact Assessment (ESIA)
ATGL voluntarily conducts ESIAs to evaluate environmental and social risks across project lifecycles. This guides proactive risk mitigation through Environmental and Social Management Plans (ESMPs), ensuring regulatory alignment and protecting ecosystems and communities.
ZEROInstances of violations in FY 2025-26 that incurred significant fines or penalties related to environmental or ecological concerns
Operational Excellence and Compliance
Our Integrated Management System is certified to ISO 9001 (Quality), ISO 14001 (Environment), ISO 45001 (Occupational Health & Safety) and is implemented across our Ahmedabad, Faridabad, Vadodara, Khurja, Mahendrakar and Palwal GAs. We aim to extend these certifications to all our GAs by 2027.
Climate Adaptation and Mitigation Plan
The Indian Scenario
The rapid expansion of the Indian economy, coupled with its continued dependence on fossil fuels to support economic growth and modernisation, has positioned India as the world’s third-largest emitter of greenhouse gases, despite its per capita emissions remaining significantly lower than those of developed countries. ATGL is committed to establishing a comprehensive decarbonisation strategy to minimise its carbon footprint while contributing to energy security and economic growth in an environmentally responsible manner.
In response to India’s growing gas and energy demand, our business sector is pivotal in promoting sustainable practices. As a significant player in the sector, we recognise our role in supporting India’s low-carbon transition while ensuring reliable energy access for residential, commercial, industrial, and transportation sectors. By setting annual environmental performance targets and continuous monitoring, we drive accountability and impact, fostering a sustainable future while meeting the nation’s energy needs.
India’s Climate Ambitions
As part of Nationally Determined Contribution (NDC) under the Paris Agreement, India has set a target of becoming Net Zero by 2070. Additionally, India intends to achieve 500 GW of non-fossil energy capacity, and source 50% of its energy requirements from renewable energy by 2030. It also aims to reduce the emission intensity of its economy by 45% and create an additional carbon sink of 2.5 - 3.0 billion tonnes of CO2 equivalent through additional forest and tree cover.
Presently in India, the share of natural gas in energy basket is 6.7% and the Government has set a target to raise the share of natural gas in energy mix to 15% in 2030. Furthermore, India is developing a domestic carbon market to encourage industries to adopt low-carbon technologies and trade carbon credits, fostering emission reductions across key sectors.
ATGL’s Climate Change Strategy: Aligned with Nation’s Ambitions
ATGL’s decarbonisation approach closely aligns with India’s Net Zero ambition by 2070 and is designed to create long-term, resilient value for stakeholders. Our Net Zero and decarbonisation commitments directly support India’s Nationally Determined Contribution (NDC) under the Paris Agreement and align with evolving global climate commitments articulated through the Conference of Parties (COP). These priorities are fully integrated with the ESG frameworks of our promoter partners, the Adani Group and TotalEnergies, ensuring strategic consistency across the value chain.
We translate these commitments into action through clearly defined annual environmental performance targets, supported by robust monitoring systems and active leadership oversight. This governance-led approach strengthens accountability, enables disciplined capital allocation, and mitigates transition risks. By systematically improving energy efficiency, reducing greenhouse gas emissions, and scaling renewable energy adoption across operations, ATGL is positioning itself to enhance operational efficiency, manage climate-related risks, and capitalise on opportunities arising from India’s low-carbon transition.
+Read further — Climate Change Policy

Our Operational Net Zero Transition Plan 2045
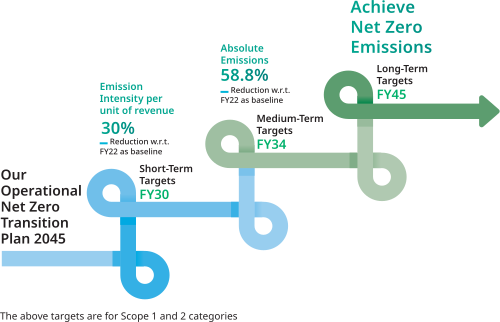
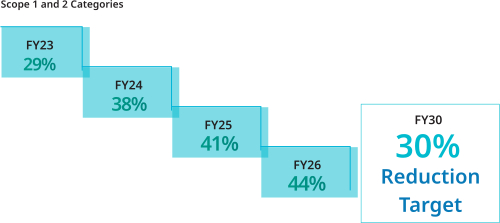
Performance Against Emission Intensity Reduction Targets w.r.t. FY22 Baseline
Board-Level - CRC and RMC
- Oversee and provide strategic guidance to the assessment and management of climate-related risks and opportunities
- Ensure systematic integration of climate risks into Enterprise Risk Management (ERM) framework
Management-Level
Chief Sustainability Officer (CSO)
- Supports RMC in identifying key risks and provides insights for their effective management
Chief Risk Officer (CRO)
- Holds accountability for managing and mitigating identified climate risks
CRC: Corporate Responsibility Committee · RMC: Risk Management Committee
+Read more about our ESG and Climate Governance in our ESG Approach section
Climate risks and opportunities are systematically integrated into our Enterprise Risk Management (ERM) framework, ensuring effective oversight, accountability at all levels and robust mitigation and adaptation plans.
Driving Accountability through Performance-Linked Remuneration
At ATGL, incentives of the leadership and employees are closely aligned with ESG and climate-related performance, ensuring accountability from the boardroom to the frontline.
Leadership and Management’s Accountability
The incentives of the Executive Board, CEO, CSO, CFO, CRO and Sustainability Manager are directly to ESG excellence through a remuneration framework recommended by the Nomination and the Remuneration Committee.
Performance Metrics
The incentives are linked to the achievement of sustainability targets, improvement in ESG ratings, and regulatory compliance. Environmental and climate-related performance KPIs include reduction in GHG emission & emission intensity, solarisation, achieving Zero Waste to Landfill certification for our sites, Tree plantations, decarbonisation of fleets, etc.
Employee Engagement: Maadhyam
Through ‘Maadhyam‘, the Adani Group’s online reward scheme, we incentivise employees to contribute. Impactful ideas on sustainability earn implementation rewards between ₹ 5,000 and ₹ 50,000), stimulating grassroots action.
Climate Risks and Opportunities Assessment
ATGL views climate change as a material factor significantly impacting long-term resilience, competitiveness, and value creation potential. However, we also recognise it as an opportunity to lead the transition towards a low carbon economy. Climate considerations are embedded into our overall business strategies, investment decisions and risk management processes to navigate emerging climate challenges effectively. Our climate adaptation and mitigation plan is informed by the physical and transition risks and is monitored through measurable science-based climate goals and targets.
Climate-Related Scenario Analysis
In alignment with IFRS S2/TCFD framework, we conducted a comprehensive climate risk assessment in FY 2024-25. The assessment helped us identify, assess and manage climate-related risks and opportunities across our upstream, downstream and own operations. The approach is guided by four core pillars: Governance, Strategy, Risk Management and Metrics & Targets. The assessment evaluated both physical and transition risks across short, medium and long-term time horizons, using globally recognised climate scenarios and pathways. These scenarios are crucial to assess the vulnerability of our assets and operations under climate stress and comprehend potential long-term financial implications. The findings directly shape our business strategy and adaptation & mitigation plans, including capital deployment and resource prioritisation for long-term operational resilience.
The assessment was conducted under various IPCC scenarios and analysed the direct and indirect impacts of climate change on ATGL’s operations, assets, and supply chain.
Scenarios Considered for Physical Risks
- SSP1-2.6 (Low GHG Emissions Scenario)
- SSP2-4.5 (Moderate GHG Emissions Scenario)
- SSP5-8.5 (High GHG Emissions Scenario)
Time Horizons Assessed
- Short-Term: 0-3 years
- Medium-Term: 3-10 years
- Long-Term: More than 10 years
The physical risk assessment covered four key Geographical Areas (GAs) — Ahmedabad, Vadodara, Faridabad and Khurja, which collectively contribute approximately 62% of ATGL’s revenue as of the fiscal year ending March 31, 2026.
The assessment analysed key risks related with transitioning to a low-carbon economy, driven by changing regulations, market dynamics, technological advancements, and shifting stakeholder expectations.
Scenarios Considered for Transition Risks
- Scenarios under Stated Policies Scenario (STEPS)
- Scenarios under Net Zero Emissions (NZE) 2050
Time Horizons Assessed
- Short-Term: 0-3 years
- Medium-Term: 3-10 years
- Long-Term: More than 10 years
Financial Implications and Cost Involved in Managing Climate-Related Risks and Opportunities
The financial implications of risks and opportunities are integrated into ATGL’s strategic planning, driving its transition to a low-carbon economy and supporting its operational Net Zero emissions target by 2045.
Climate-Related Risks
| Risk | Risk Category | Financial Implication | Cost of Managing Risks (annualised) |
|---|---|---|---|
| Physical Risks | |||
| Tropical Cyclones | Acute | ₹ 0.010–0.013 crore annually | ₹ 0.006 crore |
| Pluvial Flooding | Acute | ₹ 0.374–0.382 crore annually | ₹ 0.165 crore |
| Temperature Extremes | Chronic | ₹ 0.974–1.177 crore | ₹ 0.541 crore |
| Transition Risks | |||
| Carbon pricing mechanisms | Policy & Legal |
|
|
| Increased stakeholder concern or negative stakeholder feedback | Reputational Risk |
|
|
Climate-Related Opportunities
| Opportunity | Opportunity Description | Financial Impact Implication | Cost of Capitalising Opportunities (annualised) |
|---|---|---|---|
| Energy source | Use of lower emission sources of energy by investing into Renewable Energy |
|
|
| Products & services | Ability to diversify business activities by investing into Compressed Biogas (CBG) initiatives |
|
|
Operational Adjustments
ATGL is investing in renewable energy and low-carbon technologies to reduce emissions and operational costs while ensuring compliance with regulatory requirements.
Business Diversification
The company is expanding into low-carbon businesses like e-mobility and Compressed Biogas (CBG) to align with sustainability goals and capture emerging market opportunities.
Risk Mitigation
ATGL is implementing robust risk management frameworks to address physical and transitional risks, ensuring business continuity and resilience.
Climate Adaptation and Mitigation Roadmap
ATGL’s climate risk-aligned roadmap is designed to accelerate progress towards a low-carbon and climate-resilient future.
Reducing Emissions Across Operations
- Maximising energy efficiency
- Process optimisation
- Adoption of cleaner fuel sources
Driving Shift Toward Clean Energy Solutions for Customers
- Expanding natural gas accessibility
- Fast-tracking other low-carbon alternatives such as EV charging stations
Investing in Emerging Low-Carbon Technologies
- Hydrogen-blending, biogas, and renewable energy solutions
- Technologies enabling permanent carbon neutral/offset solutions
Read further — Climate Risk Assessment Report
Expansion of Low-Carbon Businesses (E-mobility and Biomass)
Our E-Mobility and Compressed Biogas (CBG) businesses are offering sustainable mobility and low-carbon energy solutions to the broader communities.
Current Progress
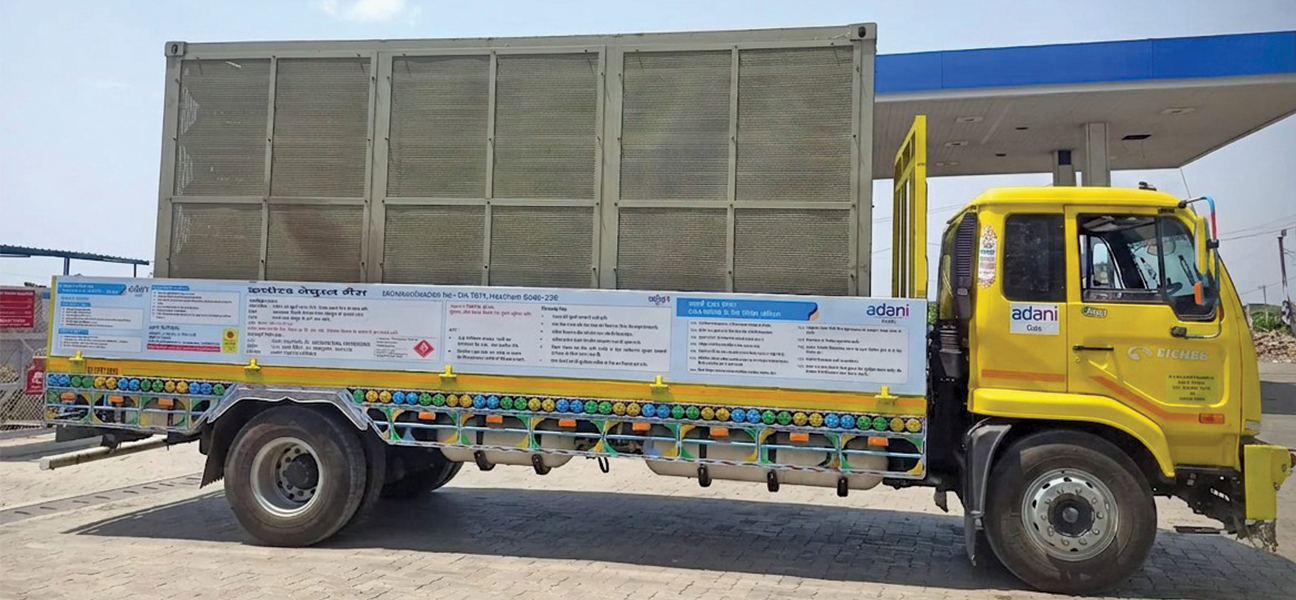
02 CBG plants with a combined capacity of 13 tonnes have been commissioned, while 1,765 electric vehicle charging stations are now operational. These ventures broaden access to low-carbon energy while supporting wider adoption of alternative fuels.
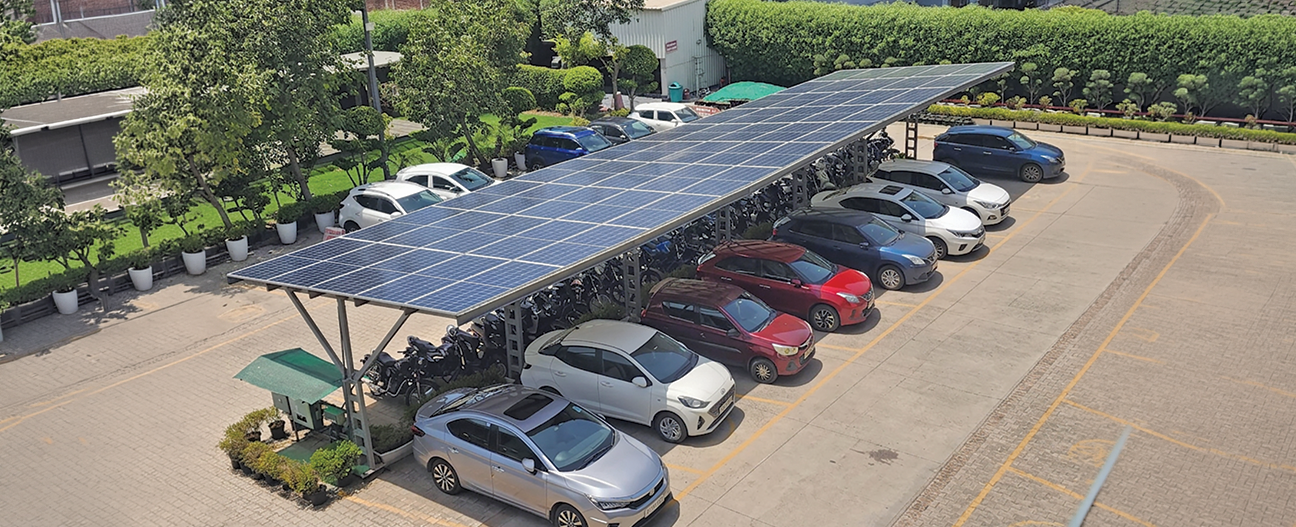
Solarisation of Operations
We have been progressively installing captive solar plants to integrate renewable energy into our operational framework and reduce dependency on conventional power sources, lowering overall GHG emissions.
Current Progress
55Sites including CNG stations, city gate facilities, and offices are installed with rooftop solar systems, generating 0.967 MW of solar power.
Rooftop Solar Capacity (in MW)
Low-Carbon Operational Mobility
To reduce GHG footprint of our logistics mobility, we have transitioned all owned and contracted vehicles from HSD to CNG, cutting down on GHG emissions significantly.
Current Progress
3,865 tCO2eEmissions were averted in FY 2025-26
Strategic Investments in Low-Carbon Technologies
We are accelerating cleaner fuel alternatives by blending hydrogen into the natural gas supply to reduce emissions. We are also evaluating alternatives such as carbon offsets, and technologies that offer permanent carbon neutral/ offset solutions, based on their effectiveness and alignment with nation’s readiness.
Current Progress
In Ahmedabad, a pilot introduced a 2% hydrogen mix into the PNG distribution system, targeting up to 8% blend. The pilot is expected to reduce emissions by ~4% in the test geography and will guide future scale-up.
Managing Methane Emissions
Our Leak Detection and Repair (LDAR) enables early detection and control of any methane leakages which are accounted under our Scope 1 emissions.
Current Progress
7,520 kilometresof pipeline infrastructure was surveyed in FY 2025-26, enabling proactive reduction in fugitive emissions into the environment and reinforcing operational safety.
Carbon Sequestration
As part of Adani Group’s pledge to grow and conserve 100 million trees by 2030, we conduct mass plantation which also act as natural carbon sinks.
Current Progress
Total 0.321 millionTrees have been planted by ATGL so far, with 51,000 trees plantation (on-going)
Carbon Credits
We are exploring offset opportunities through credible and high-quality carbon credits from the Varanasi Smart City Bio-Conversion project (registered under Verra’s Verified Carbon Standard) and the ATBL Bio-CNG projects (registered under the Gold Standard for the Global Goals).
Internal Carbon Pricing (ICP)
ATGL has implemented an Internal Carbon Pricing (ICP) mechanism to capture the financial implications of emissions in business decisions. The framework enables us to factor in carbon costs while evaluating projects, investments, operational choices, and overall decision-making, strengthening our preparedness for evolving climate regulations.
| Type of ICP | Coverage | Price (₹/tCO2) | Price-setting approach |
|---|---|---|---|
| Shadow Pricing | Organisation-wide for Scope 1 & 2. Emission considerations are integrated into the evaluation of major capital investments, projects, and strategic business decisions | ₹ 1,795–2,137 | Internal deliberations informed by global carbon price benchmarks, emerging regulatory signals, and long-term decarbonisation pathways relevant to ATGL’s operating context |
Climate Action Through Public Policy Engagement
ATGL champions climate action through a dedicated ‘Responsible Advocacy Framework’, in line with Paris Agreement. By partnering with key industry bodies and trade associations, we influence policy discussions and promote sustainable alternatives. These strategic collaborations amplify our advocacy and foster supportive regulatory environments for meaningful progress toward global climate and decarbonisation targets.

Energy and Emissions Management
Our Board has approved the Climate Change Policy and Energy Management Policy that steer our energy and low-carbon roadmap for a greener future.
Driving Performance Excellence
Optimising operations and energy use across our network to reduce emissions and enhance overall efficiency
Expanding the Energy Mix
Incorporating cleaner fuels and renewable sources to diversify energy supply and lower carbon intensity
Green Energy Transition
Deploying innovative technologies and low-carbon solutions to support a sustainable energy future
Driving Operational Energy Excellence
At ATGL, we are reducing our energy footprint through high-efficiency technology with data-driven optimisation across our City Gas Distribution (CGD) framework.
Smart Infrastructure and Innovation
Grid Electricity and fuel used in compressors at gas dispensing facilities are the primary drivers of energy consumption. We are minimising it by integrative smart solutions across our CGD operations, including:
- Deploying SCADA-based monitoring systems to slash energy waste and methane losses
- Implementing innovative solutions such as vortex-based pressure reduction and natural gas-based HVAC systems
- Secured IGBC Gold green building certification for our corporate office at Inspire Business Park, with plans to scale these standards for our CNG stations
Continuous Improvement
Rigorous energy audits across our sites, quantified energy targets and employee training institutionalise ‘Efficiency-First’ culture:
- Site-Retrofits: LED lights, occupancy sensors, and AC savers
- Clean Mobility: Phasing out petrol/diesel-based transport by switching to EVs and LNG options
Energy Performance
11,12,830 GJEnergy consumed from non-renewable sources in FY 2025-26
4,067 GJEnergy consumed from renewable sources FY 2025-26
Energy Consumption within Organisation
Emissions Management
GHG Emissions Profile
(in MTCO2e)
Note: ATGL’s Scope 2 emissions are calculated using both location-based and market-based methods, in line with the GHG Protocol - Corporate Standard, Scope 2 Guidance, 150 14064, and IPCC 2006 Guidelines. This ensures reporting remains consistent, transparent, and aligned with actual electricity consumption.
- Location-Based Method: Uses Central Electricity Authority (CEA) grid emission factors to represent the average emissions intensity of the Indian grid
- Market-Based Method: Due to the unavailability of a residual mix in the Indian context, a simplified method permitted by the GHG Protocol is adopted, applying CEA grid factors for non-renewable electricity and zero emissions for renewable purchases
Note:
- Methane leaks are the primary source of our Scope 1 emissions
- Our Advanced Leak Detection System has significantly improved quantification and reporting of methane leaks, which was earlier done using assumption-based reporting. Methane leaks account for 0.17% of the total gas sold during the reporting period
- ATGL sources its grid electricity directly from the local grid. ATGL’s Scope 2 emissions are reported solely using the location-based method, representing emissions from the local grid electricity used
- Scope 2 emissions are offset using rooftop solar power for captive consumption
Value Chain Emissions Across Scope 3 Categories
88.26% of our value chain emissions are from categories ‘Use of sold products’ category which was 98.40% in FY 2024-25. We currently report our value chain emissions across the following Scope 3 categories:
| Category | FY 2024-25 | FY 2025-26 |
|---|---|---|
| Category 1: Purchased goods & services | – | 2,76,184 |
| Category 2: Capital goods | 8,026 | 21,222 |
| Category 3: Fuel-and-energy related activities | 24,359 | 8,465 |
| Category 5: Waste generated in operations | 41 | 0.58 |
| Category 6: Business travel | 376 | 2,490 |
| Category 7: Employee commute | 421 | 264 |
| Category 11: Use of sold products | 20,41,654 | 23,20,593 |
Note: The other Scope 3 categories are not applicable for ATGL business and hence are not reported in the table above.
Non-GHG Emissions and Ozone-Depleting Substances (ODS)
Fuel combustion in compressors at gas dispensing facilities, vehicular exhausts and dust emissions in certain activities are the major sources of non-GHG emissions. We have already replaced high Ozone-Depleting Potential (ODP) and high Global Warming Potential (GWP) refrigerants in our HVAC systems with sustainable alternatives. We are mapping and quantifying these emissions to ensure accurate reporting and drive continuous improvement in environmental performance.
Air Emissions
| Parameters | Unit | FY 2024-25 | FY 2025-26 |
|---|---|---|---|
| SO2 | Kg/year | 0 | 0.96 |
| NOx | Kg/year | 108.66 | 111.39 |
| Particulate Matter | Kg/year | 93.42 | 84.98 |
Note: Air emissions data covers point source stack emissions from the Company’s relevant operating locations, including Ahmedabad, Vadodara & Faridabad.
Sustainable Water Management
Goal: Become Water Positive by 2030
Water scarcity poses one of the most pressing environmental challenges in these times. As water stress deepens globally, our approach to water management has evolved from compliance to strategic value creation. We recognise that sustainable water stewardship is not just an operational necessity, but also a fundamental pillar of long-term resilience and community wellbeing.
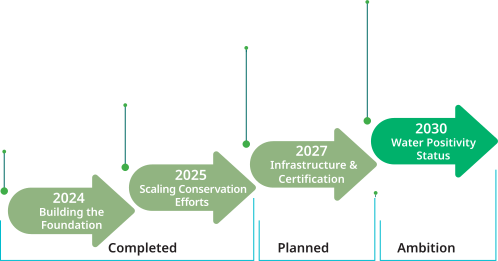
A Clear Vision: Water Positive by 2030

Our water positivity target for 2030 is underpinned by a Board-approved Water Stewardship policy and a phased implementation roadmap that translates vision into measurable action. This commitment addresses both environmental responsibility and risk mitigation in water-stressed geographies.
Our Water Stewardship Approach
Efficiency
Expanding metering and audit practices across all facilities for monitoring and identifying improvements
Conservation & Replenishment
Implementing rainwater harvesting systems and community water restoration projects to replenish groundwater
Circular Solutions
Exploring opportunities for recycling, reuse and community water restoration project to enhance groundwater levels
Water Stewardship Roadmap
Decisive Actions for Water Stewardship
Efficiency Monitoring
Water meters have been deployed across operational sites to monitor consumption patterns, detect leakage & inefficiencies and avoid wastage.
Environmental Impact Assessments
Environmental Impact Assessments (EIAs) with specific water focus are conducted across geographical areas, integrating water considerations into operational planning from the beginning.
Compliance and Continuous Improvement
Third-Party audits have been conducted at all 75 sites, identifying targeted improvement opportunities. These audits ensure transparency and continuous enhancement of our water management practices.
72Of our sites have undergone third-party water audits
Zero Industry Effluent
100%Of domestic wastewater is discharged to municipal sewage networks or soak pits. No industrial effluent is generated from our operations. Periodic water audits ensure full compliance with statutory standards and continuous improvement in wastewater quality.
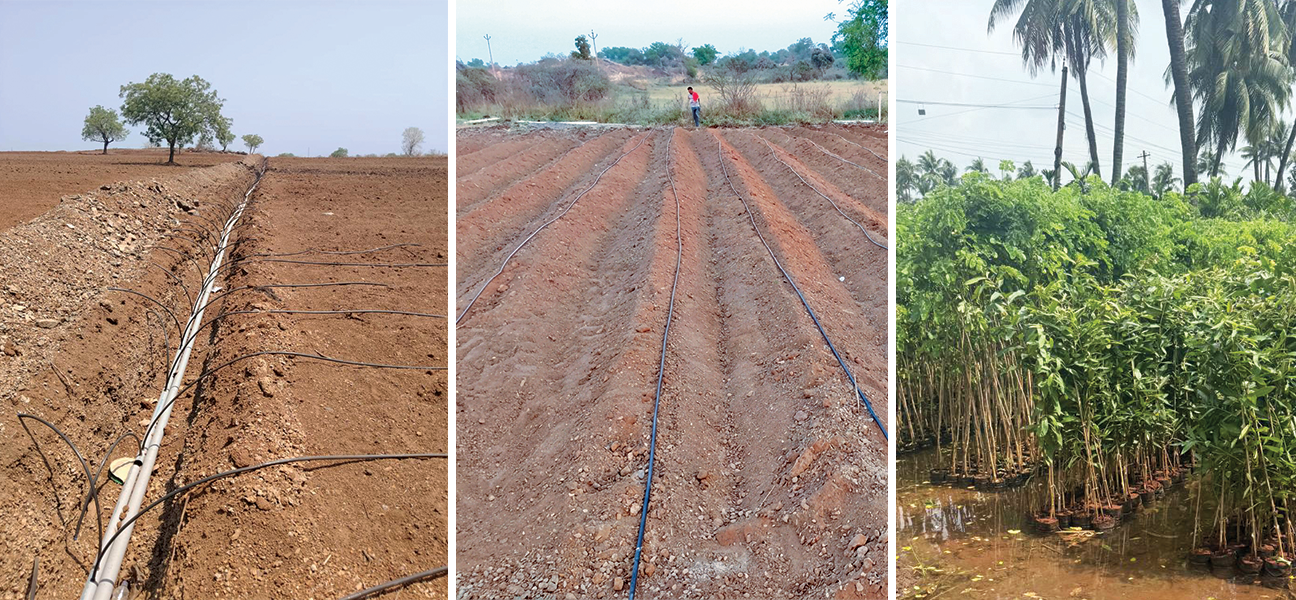
Water-Efficient Afforestation
To promote sustainable greening, we planted a total of 856 saplings of water-containing trees using Rakshak Self-Watering Tree Guards. This innovative system ensures:
- 15 litres water storage with gradual release at the root zone
- Up to 70% water saving through elimination of evaporation losses
- Deep root irrigation that promotes faster and healthier vertical growth
- Protection from external threats like cattle and human interference
- Higher survival rate of saplings, ensuring their transformation into trees within two years
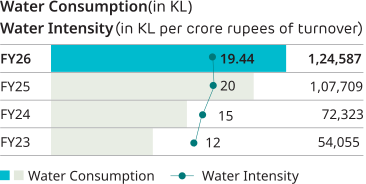
Performance Against Water-Related KPIs
Note
- All water withdrawals equate to recorded water consumption
- Recorded water consumption refers to the water meter-based value and in some cases, it is based on average footfall of visitors and employees where water meter is not available
- Third-party water refers to water provided by municipal water suppliers through tankers
- Out of the total water withdrawal above, the freshwater water withdrawal (≤1,000mg/L Total Dissolved Solids) in FY 2025-26 is: 1,24,587 kilolitres
- Out of the total water withdrawal above, the other water (>1,000 mg/L Total Dissolved Solids) in FY 2024-25 is: Zero
Read more about our water management in BRSR - Principle 6
Circular Waste Management
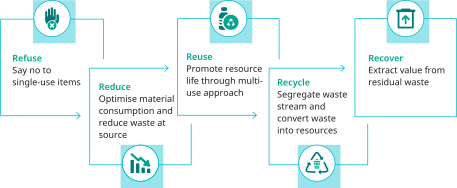
5R Approach for Circular Resource Efficiency
Driving Circular Value
We implement waste management framework rooted in 5R philosophy to minimise environmental footprint, strengthen compliance and improve resource efficiency. This approach is guided by robust policies, well-defined procedures and efficient monitoring systems. We have set quantified waste reduction targets to prioritise waste avoidance, material recovery and circularity across operations. Circular economy principles are also embedded into daily operations and supply-chain practices, ensuring consistent implementation across the organisation’s footprint.
Our operational footprint has no major land degradation impact, with all generated waste traceable to our direct activities.Performance Highlights
Our commitment to circular resource management is backed by rigorous monitoring and quantified targets:
Total Waste Recycled
99% MTRecycling Rate (of total waste generated)
Responsible Waste Handling
Our waste streams are managed through structured processes in compliance with applicable waste management rules.
| Waste Categories | Waste Types | Waste Handling |
|---|---|---|
| Hazardous Waste | E-waste and battery waste generated from own operations | Safely collected, segregated, and disposed through PCB-authorised recyclers |
| Used oil collected from the customers at CNG stations and generated by own operations | ||
| Non-Hazardous Waste | Plastic waste (small MDPE pipe, empty barrels), generated from own operations | Directed to certified vendors for diversion from landfills through recycling and reuse |
| Metal scraps generated from decommissioned assets |
Committed to circular resource management, we successfully recycled 125.01 MT of waste, accounting for 99% of the total waste generated in FY 2025-26.
End-to-End Waste Management Programme
Structured waste management prioritising minimisation, segregation and disposal through reuse and recycling channels, systematically reducing landfill dependency
Operational Controls
Site-level waste audits, independent third-party verification and vendor partnerships for material recovery strengthens transparency, compliance and continuous improvement
Paper-Saving and Plastic Elimination
Paper-Saving measures and progressive phase out of single-use plastics in office operations
Offices are certified as Single-Use-Plastic-Free
Zero Waste to Landfill Certification
ATGL achieved and sustained Zero Waste to Landfill (ZWL) status across its Corporate Office and key operational locations, including Ahmedabad, Faridabad, Khurja, and Vadodara, collectively covering 62% of its revenue-generating sites. This achievement has lowered our disposal costs, and regulatory risks through enhanced resource efficiency.
Of ATGL are now Zero Waste to Landfill-certified as of FY 2025-26
Waste diverted from landfills in FY 2025-26
Performance Against Waste-Related KPIs
In Metric Tonnes
| Indicators | FY 2021-22 | FY 2022-23 | FY 2023-24 | FY 2024-25 | FY 2025-26 |
|---|---|---|---|---|---|
| Waste Generated | |||||
| Hazardous Waste | 55.97 | 63.60 | 33.61 | 37.30 | 52.34 |
| Non-Hazardous Waste | 183.99 | 129.78 | 130.60 | 102.47 | 75.01 |
| Total Waste Generated | 239.96 | 193.38 | 164.21 | 139.77 | 127.35 |
| Waste Diverted from Disposal | |||||
| Hazardous Waste | 55.97 | 63.60 | 33.61 | 37.30 | 52.34 |
| Non-Hazardous Waste | 183.99 | 129.78 | 130.60 | 102.47 | 74.01 |
| Total Waste Diverted from Disposal | 239.96 | 193.38 | 164.21 | 139.77 | 126.35 |
Biodiversity and Ecosystem Preservation
Goal: Achieve a net positive impact by 2030
As signatories to India Business and Biodiversity Initiative (IBBI), we align with global best practices that promote responsible interaction with ecosystems. This partnership ensures that our biodiversity management remains world-class and transparent.
Our Biodiversity Lens
Our biodiversity blueprint is aimed at not just protecting nature but giving back more than we take by 2030.
Our Board-approved Biodiversity Policy reframes our relationship with the nature. We do not view ecosystems merely as resources, but as partners in progress. This policy establishes a rigorous framework for assessing, managing, and mitigating potential risks across our operations. Our structured hierarchy of mitigation involves preventing ecological impacts as the first line of defence. Where impacts cannot be fully avoided, we try to reduce them and undertake restorative measures, including habitat restoration and large-scale plantation drives. We have also introduced a biodiversity integration framework, covering ten key areas ranging from incorporating biodiversity into Environmental Management Systems to engaging stakeholders in conservation programmes.
Avoid: Prioritising prevention where impact is unavoidable
- Avoid operations in ecologically sensitive zones
- Avoid tree cutting especially during bird nesting seasons
Reduce: Minimising the footprint where operations are unavoidable
- Routing gas pipelines away from wildlife habitats, wherever possible, to minimise disturbance
Restore: Returning Ecosystems to their natural states
- Greenmosphere Biodiversity Park, Ahmedabad
- Forest and habitat restoration via the ‘Revival of Roots’ initiative in Kajalgaon, Assam
- Mass Plantation by Miyawaki techniques in Washim district of Maharashtra. (On-going project)

Managing Biodiversity Risks
Biodiversity risks are integrated into our Enterprise Risk Management (ERM) framework for continuous oversight and systematic management.
Pre-Operations Assessment for Risk Identification
- Comprehensive Environmental Impact Assessments (EIAs) are undertaken for all Geographical Areas (GAs) before commencing the operations
Biodiversity Management Plans
- EIA findings inform the development of comprehensive Biodiversity Management Plans (BMPs) to address the impacts related to land, water and biodiversity
Compliance and Reporting
- EIA reports are submitted to the concerned regulators for compliance verification
- Regular audits and assessments identify areas of improvement and ensure compliance
Sites covered under biodiversity/ environment impact assessments
Significant biodiversity risks identified as per the ESIA study
Biodiversity/Environment Impact Assessment of Sites
| Parameters | FY 2023-24 | FY 2024-25 | FY 2025-26 |
|---|---|---|---|
| Total number of Geographical Areas (GAs) | 33 | 33 | 34 |
| Total sites covered under biodiversity / environment impact assessments | 19 | 23 | 24 |
| Total sites which are in close proximity to critical biodiversity / environment | 0 | 0 | 0 |
| Total sites in close proximity to critical biodiversity/environment for which biodiversity/environment management plans are prepared | NA | NA | NA |
| Other low-priority sites for which biodiversity/environment management plans are prepared | 03 | 04 | 00 |
Green Initiatives through Stakeholder Engagement
Tree Plantation for a Greener Future
ATGL undertakes extensive tree plantation activities to create natural carbon sinks, reduce GHG concentrations and enhance climate resilience. We plant trees as part of our Greenmosphere and Revival of Roots projects, consulting and engaging with the local authorities and communities throughout the execution and maintenance phase.
Tree Plantation Pledge on WEF’s 1t.org Forum
As part of the Adani Group’s pledge to plant 100 million trees by 2030, under the World Economic Forum’s Trillion Trees Platform (1t.org), ATGL has committed to planting 0.4 million trees by 2030.
FY 2025-26
Cumulative Progress