Tracking the Momentum of Our Expansion/the Metrics Behind Our Scale-Up
Our growth story is reflected not only in the size of our network, but in how effectively scale is converted into performance. The following metrics highlight our financial momentum, expanding infrastructure footprint and operating discipline as we extend clean energy access across India.
Financial Performance
Revenue from Operations (₹ crore)
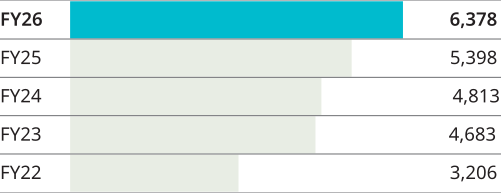
Commentary: [Revenues grew steadily from ₹ 3,206 crore in FY22 to ₹ 6,378 crore in FY26, driven by CGD network expansion, strong CNG and PNG volume growth, and calibrated pricing actions.]
Total Assets (₹ crore)
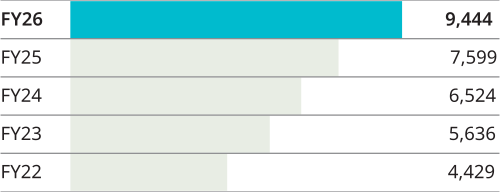
Commentary: [Total assets increased from ₹ 4,429 crore in FY22 to ₹ 9,444 crore in FY26, reflecting sustained investments in CGD infrastructure and selective expansion into EV charging, CBG and LNG.]
EBITDA (₹ crore)
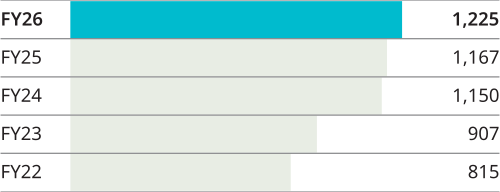
Commentary: [EBITDA rose from ₹ 815 crore in FY22 to ₹ 1,225 crore in FY26, supported by continuous volume growth and operating excellence. FY26 margins remained stable despite lower APM allocation, Currency depreciation lead to higher gas cost, aided by diversified sourcing and calibrated pricing actions.]
PAT (₹ crore)
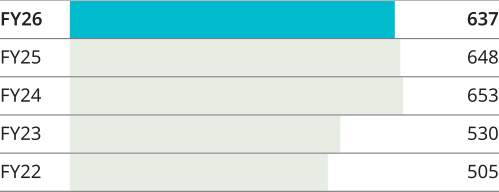
Commentary: [PAT increased from ₹ 505 crore in FY22 to ₹ 637 crore in FY26, reflecting stable earnings delivery despite input cost volatility and sector-wide pressures.]
Net Debt to EBITDA (X)
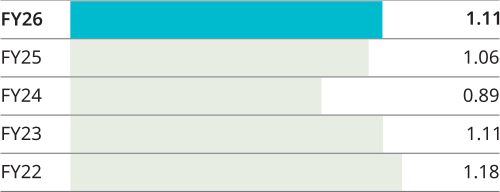
Commentary: [Net debt to EBITDA remained within a healthy range and stood at 1.11 in FY26, supported by strong cash generation even as debt increased to fund network expansion.]
Return on Equity & Return on Capital Employed (%)

Commentary: ROE and ROCE moderated from FY22 to FY26 due to higher investments in long-gestation CGD assets such as Pipeline and CNG stations particularly in newer geography, which expanded the capital base ahead of earnings contribution. As these assets scale up and operating efficiencies kick-in, capital productivity and returns are expected to strengthen over the medium term.
Operational Performance
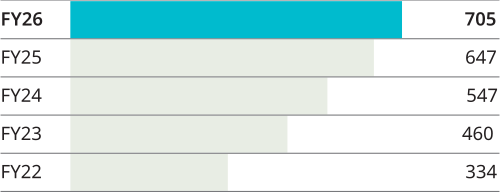
CNG Stations (numbers)
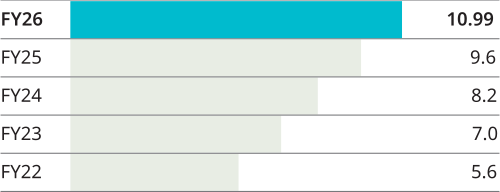
Home PNG Connections (numbers in lakhs)
Steel Network (inch-kms)
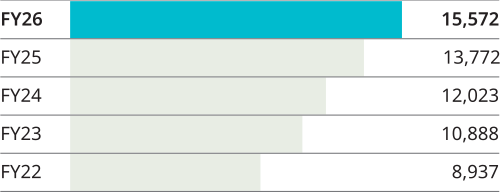
Total Volume (MMSCM)